Inspect Events
The inspector lists the events you send to a workflow. Once you choose a trigger and send events to it, you'll see those events in the inspector, to the left of your workflow.
Clicking on an event from the list lets you review the incoming event data and workflow execution logs for that event.
You can use the inspector to replay events, delete them, and more.
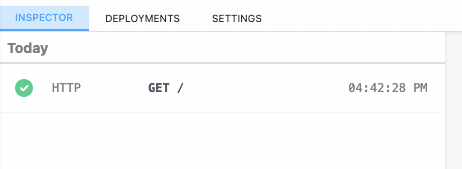
The inspector
The inspector lists your workflow's events:
Event Duration
The duration shown when clicking an individual event notes the time it took to run your code, in addition to the time it took Pipedream to handle the execution of that code and manage its output. Specifically,
Duration = Time Your Code Ran + Pipedream Execution Time
Replaying and deleting events
Hover over an event, and you'll see two buttons:
The blue button with the arrow replays the event against the newest version of your workflow. The red button with the X deletes the event.
Messages
Any console.log() statements or other output of code steps is attached to the associated code cells. But $.flow.exit() or errors end a workflow's execution, so their details appear in the inspector.
Limits
Pipedream retains a limited history of events for a given workflow. See the limits docs for more information.